


What Is Exhibitor ROI Reporting? Definition, Benefits, and Core Metrics
After the final day of an exhibition, most event teams face the same problem: badge scan exports in one system, meeting logs in another, sponsorship notes in a spreadsheet, and attendee engagement data from an app only part of the audience used. Pulling those into a coherent exhibitor report takes days. By that point, exhibitors have already started making renewal decisions without the proof they needed.
Reporting that arrives late does not just inconvenience exhibitors. It costs organizers the commercial moment when data can still shape what happens next. Exhibitor ROI reporting should connect engagement, meetings, lead capture, sponsorship performance, and renewal strategy before the next sales cycle starts.
Used well, exhibitor ROI reporting gives organizers the proof they need to defend pricing, support renewals, strengthen sponsor packages, and show exhibitors why the event deserves a bigger place in next year's budget.
Key takeaways:
- Exhibitor ROI reporting connects exhibitor outcomes to registration, meetings, engagement, lead capture, and sponsorship data
- A reporting system is different from a post-event summary dashboard because it shapes decisions before, during, and after the event
- Vanity counts like app opens and booth traffic matter less than buyer-intent signals such as meetings booked, qualified leads, profile saves, and content engagement
- Low app adoption weakens reporting confidence because fewer attendee actions become usable intent signals
- Unified data gives organizers stronger renewal conversations, better sponsorship pricing, and clearer proof of exhibitor value
Why current reporting leaves renewal proof on the table
Current exhibitor ROI reporting fails when organizers treat it as a post-event task instead of a commercial workflow. Registration, meeting activity, attendee engagement, lead capture, and sponsorship performance often live in separate tools, forcing event teams to reconcile the story after the window for action has closed.
Post-event decks arrive after commercial decisions
By the time a polished recap deck lands in an exhibitor's inbox, they have already had three internal conversations about renewal. The report shows up two weeks too late to shape any of it.
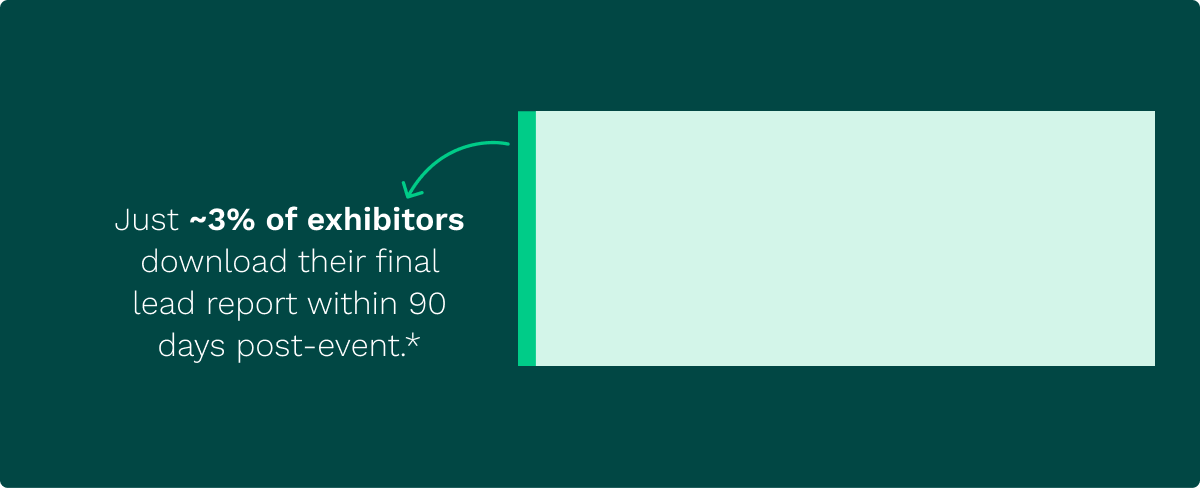
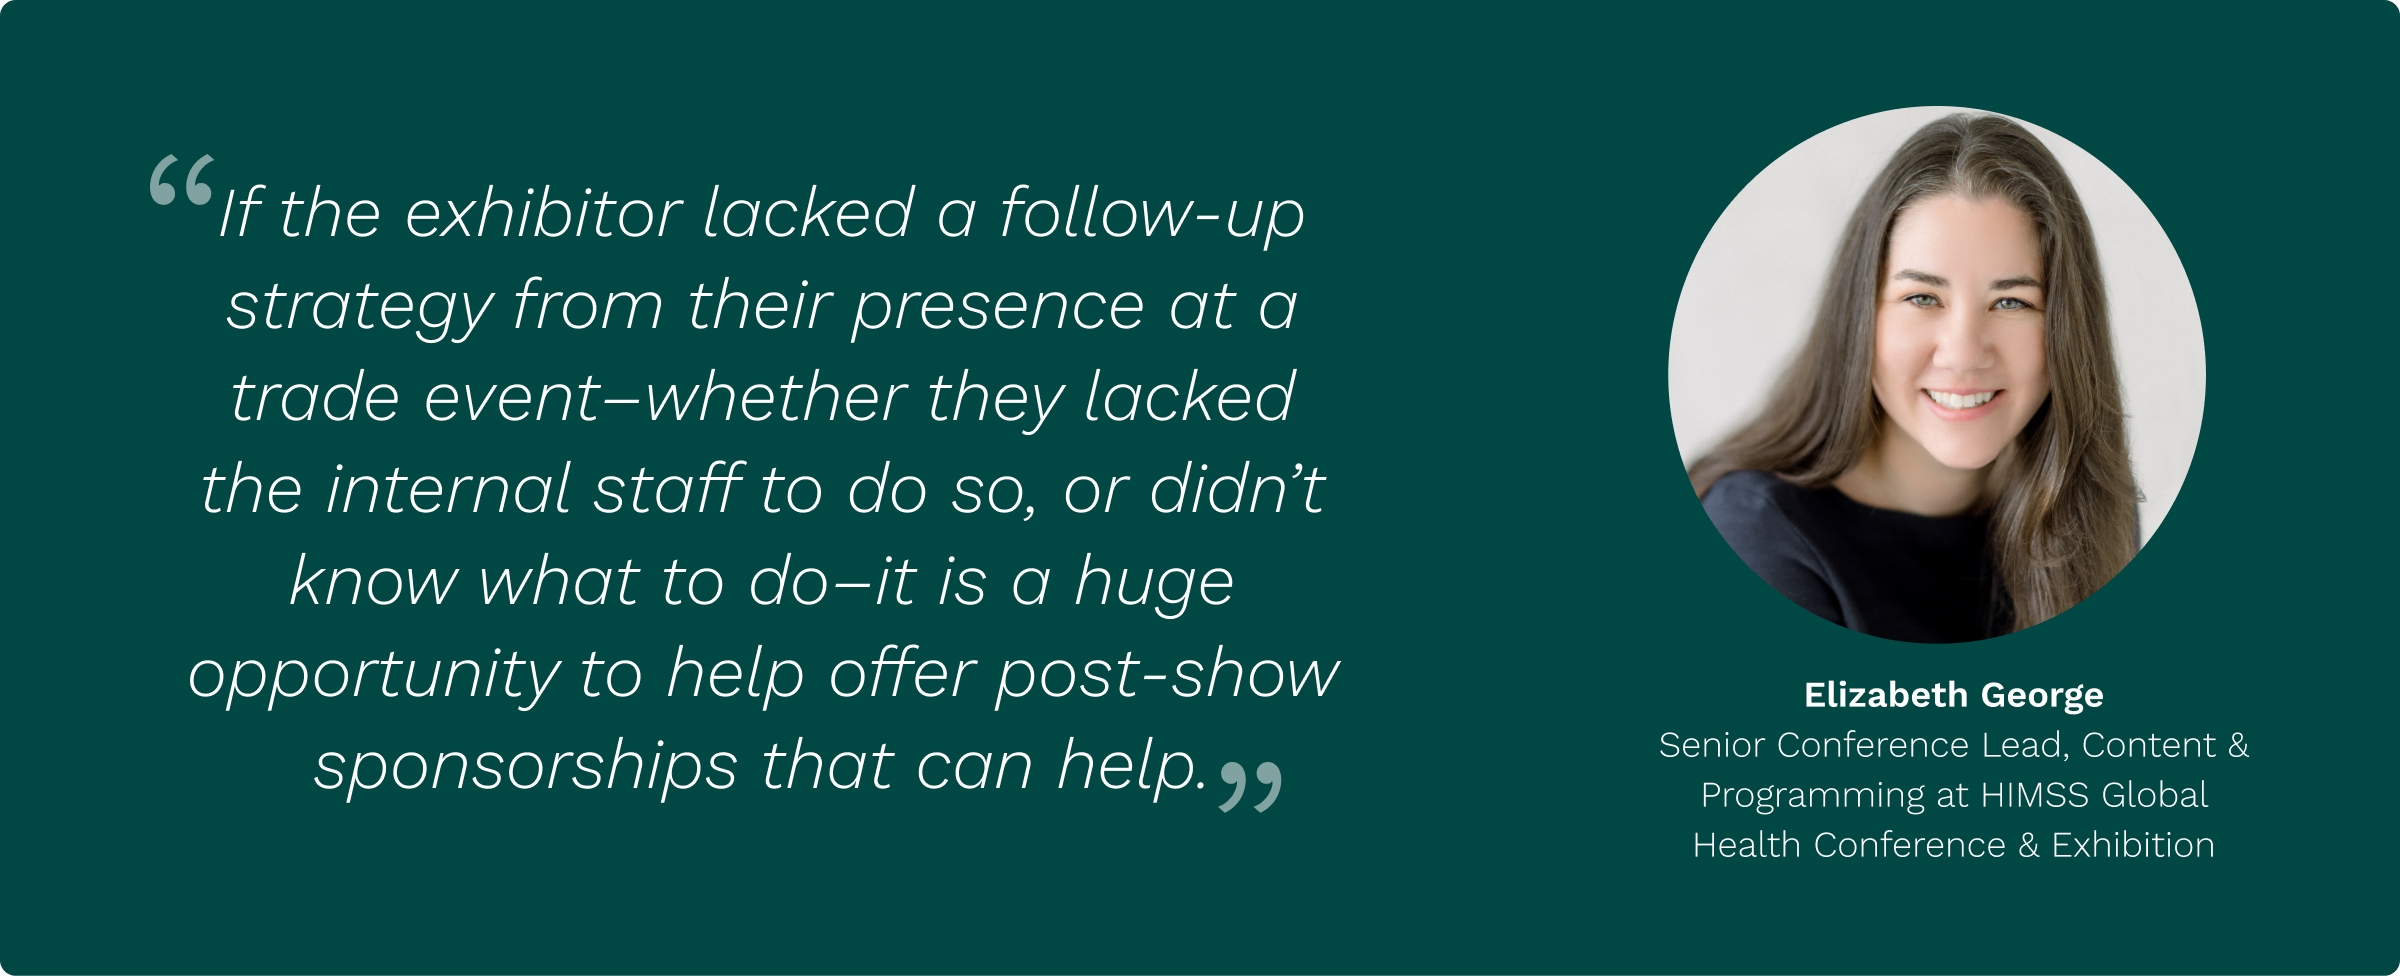
That timing gap is costly. Reporting that starts after the show can explain what happened but rarely changes what comes next. Before the event opens, teams need to know which exhibitors are under-engaged. During the show, they need to catch sponsors missing promised visibility and route interested buyers into meetings. A useful test: if your exhibitor success team cannot pull renewal-relevant proof within a few days of closing, the reporting model is a wrap-up exercise rather than an operating tool.
Fragmented tools make data reconciliation the real workload
Picture an event operations manager at 7:30 PM on the final day of a B2B conference in Frankfurt. She is checking one export for session attendance, another for badge scans, another for meeting requests, and a separate Google Sheet for sponsored placements. None of the attendee IDs match cleanly across systems. Nobody is fully sure whether a profile view, a saved booth, and a scanned badge came from the same buyer. That is not reporting. That is data reconciliation with a deadline attached.
Fragmentation creates a hidden tax on every reporting cycle. Registration sits in one system, the mobile app in another, matchmaking in a third, lead capture in another, and sponsorship inventory in a spreadsheet that only the commercial team fully understands. Each system may do its job, but none of them owns the full exhibitor journey.
Low adoption weakens every proof point
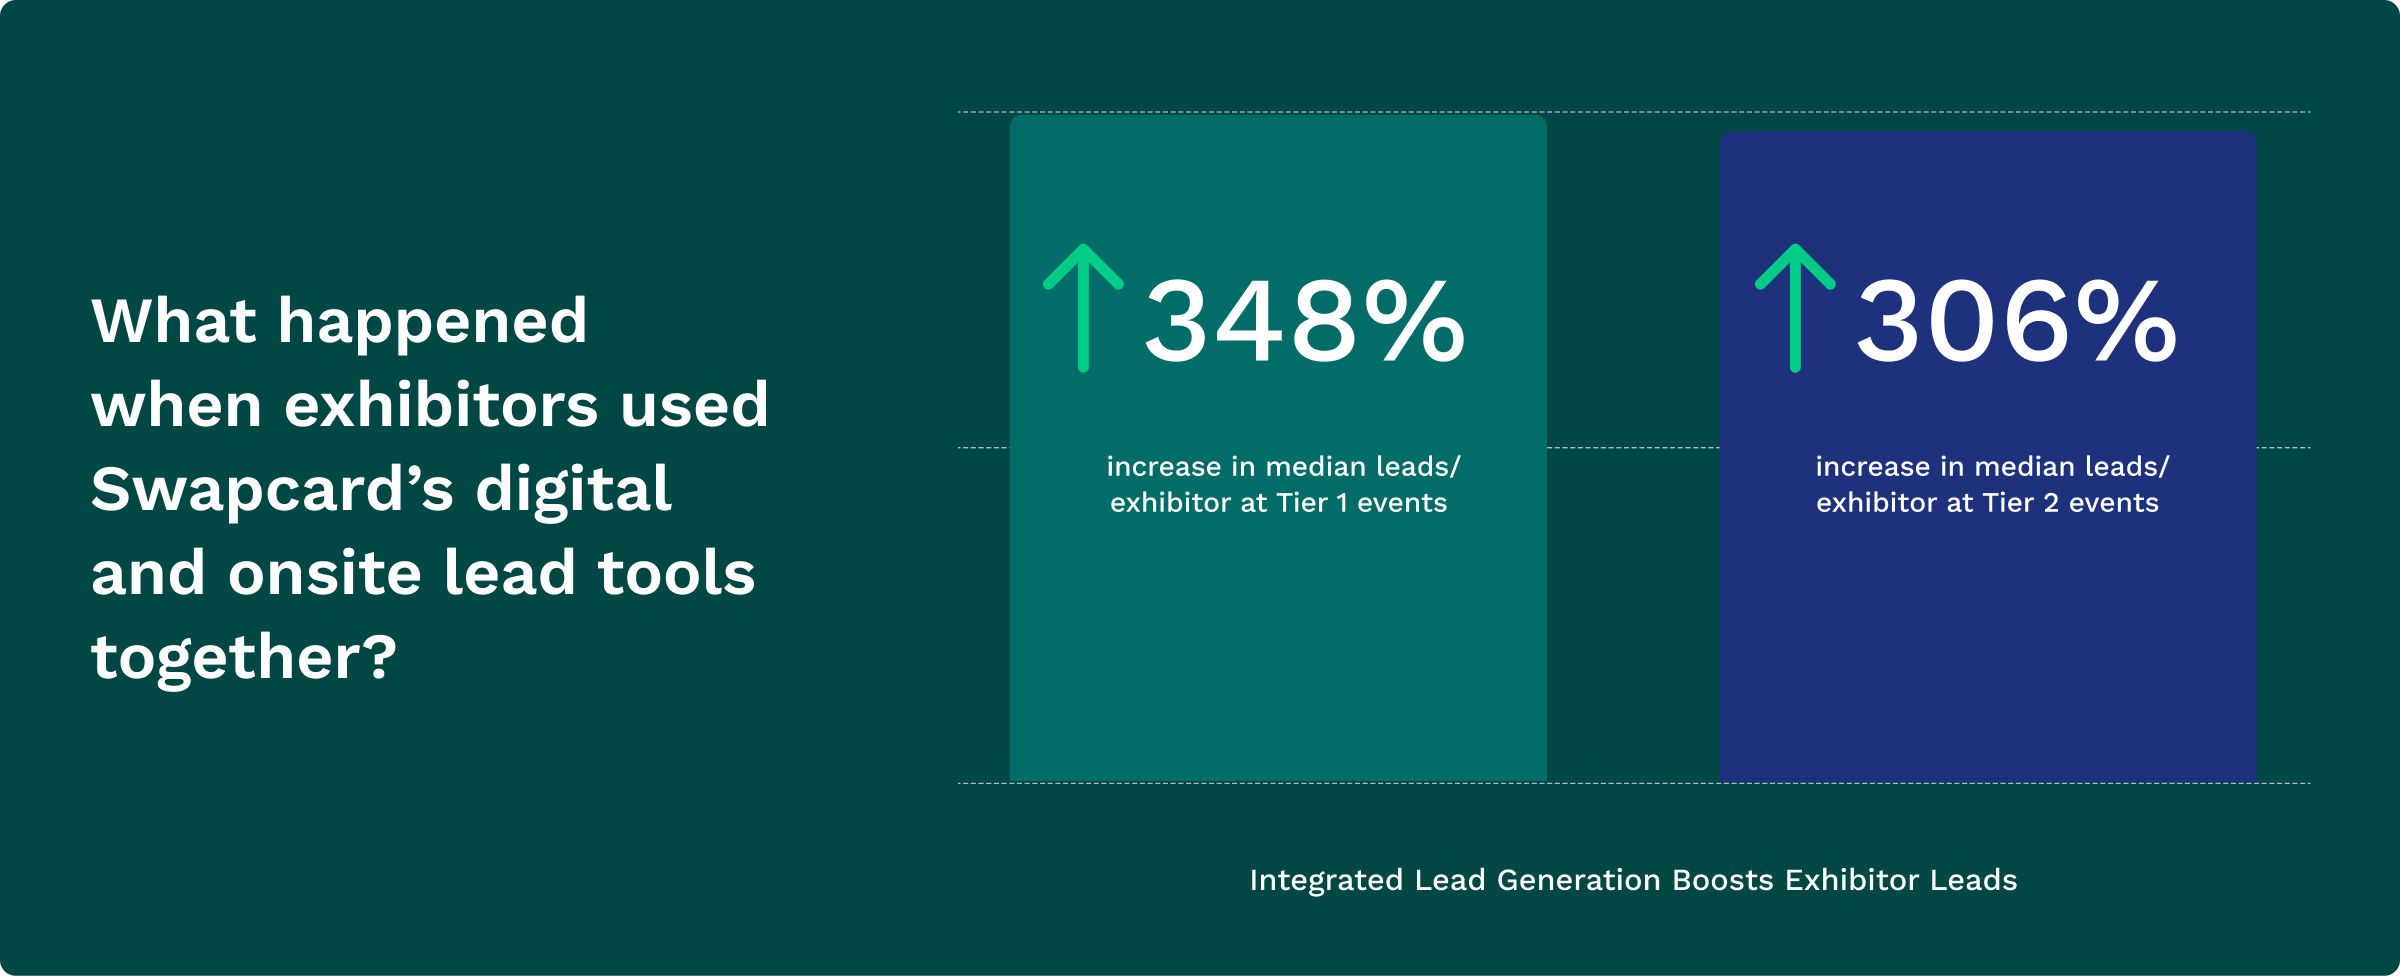
When a minority of attendees actively use the event app, the data skews toward the most digital users and misses a large share of real behavior. That creates a confidence problem, especially when exhibitors are asking hard questions about lead quality and buyer reach. Thin adoption produces thin signal, and thin signal means renewal conversations built on partial evidence.
This does not mean every report is invalid. It means organizers must be honest about signal quality. A badge scan is useful, but it is only one signal. A richer reporting model needs profile views, saved exhibitors, meeting requests, content engagement, session interests, lead qualification, and sponsor interactions. If app adoption sits below 50%, treat every attendee-behavior metric as directional rather than definitive, and invest in adoption before adding more dashboards. Which parts of the reporting model can survive that honesty test, and which need rebuilding from scratch?
Reframe reporting as an operating system
Exhibitor ROI reporting is a system for connecting exhibitor activity to measurable commercial outcomes across the full event lifecycle. It starts before the show with registration and intent capture, continues onsite through meetings and engagement, and extends after the event into follow-up, renewal planning, and sponsorship pricing decisions.
Draw the boundary before metrics multiply
A dashboard shows what happened. A reporting system defines which data matters, where it comes from, how it connects across tools, and who uses it to make decisions. That boundary matters because event teams can drown in numbers that look useful but do not support a commercial decision.
A practical boundary is simple. If a metric cannot help an organizer improve exhibitor renewals, sponsor performance, lead quality, or pricing confidence, it belongs in a secondary view. Attendance, app downloads, and booth visits can still appear in reporting, but they should not carry the story alone. Exhibitor ROI reporting should prioritize signals that show whether the right buyers engaged with the right exhibitors in ways that support follow-up.
Treat the exhibitor journey as a timeline
The exhibitor journey starts long before booth staff scan badges. Registration data can reveal buyer type, job role, region, product interest, and ticket category. Pre-event engagement can show which attendees viewed exhibitor profiles, saved sessions, searched for categories, or requested meetings. Onsite activity then adds badge scans, meeting check-ins, session behavior, booth visits, and lead qualification.
The post-event phase should connect follow-up speed, lead export behavior, content views, and renewal readiness back to the pre-event and onsite picture. A simple timeline gives organizers a clearer view:
- Pre-event intent: Registration fields, profile interests, exhibitor views, meeting requests, and saved items
- Onsite engagement: Badge scans, hosted buyer meetings, session attendance, booth QR scans, and sponsor interactions
- Post-event value: Qualified lead exports, follow-up readiness, sponsorship delivery proof, and renewal indicators
Make sponsorship performance part of the same record
Manual sponsorship selling blocks scalable monetization and obscures performance reporting. The typical prospectus still treats sponsorship like a static menu: logo placement, email inclusion, banner ad, premium booth location, maybe a hosted session. That format is easy to sell once, but it becomes difficult to prove when sponsor expectations move from visibility to measurable value.
Sponsorship performance belongs inside exhibitor ROI reporting because sponsors are often exhibitors with bigger commercial expectations. If a sponsor paid for profile placement, push visibility, sponsored content, or meeting access, the report should show delivery and engagement in the same view as leads and meetings. Otherwise, the sponsorship team walks into renewal discussions with anecdotes instead of proof, and that weakens pricing power. Anecdotes lose renewals. Records win them.
What to measure first
The first exhibitor ROI reporting model should focus on buyer-intent and revenue-proxy signals rather than every available event metric. Organizers should start with a small set of metrics that connect attendee behavior to exhibitor outcomes. From there, the reporting model can expand without becoming another bloated spreadsheet.
Separate vanity counts from buyer intent
Vanity counts are often misunderstood. App opens, page views, total attendees, and raw booth traffic can show reach. They do not prove that an exhibitor met relevant buyers, captured qualified leads, or received sponsor value that supports renewal. That distinction is where many trade show reports go wrong.
A better test is to ask whether the metric shows intent, fit, or commercial progress. A profile view from a matched buyer is stronger than a generic directory impression. A meeting request is stronger than a session bookmark. A qualified lead with notes is stronger than a raw scan. The more a signal reflects buyer interest and exhibitor action, the more weight it deserves in exhibitor ROI reporting.
Build the first metric set around five signals
Event teams do not need 40 metrics to start. In fact, 40 metrics often hide the story. The first version of exhibitor ROI reporting should be clear enough for the sales team, sponsorship team, and exhibitor success team to explain without a separate training session.
A sensible first set includes:
- Qualified leads captured: Badge scans, booth QR scans, business card scans, and lead forms with qualification details
- Meeting activity: Requested, accepted, scheduled, and attended meetings, especially hosted buyer or curated meetings
- Digital engagement: Exhibitor profile views, saves, content clicks, item views, and chat activity
- Sponsorship performance: Sponsored placement delivery, clicks, views, content engagement, and related leads
- Follow-up readiness: Exported leads, CRM-ready data, staff notes, and qualification scores
This is where exhibitor ROI becomes more than a phrase. It becomes a practical reporting structure that connects buyer behavior to exhibitor value, then gives the organizer a stronger commercial story.
Use thresholds to decide what belongs
Every metric needs a threshold, or the report becomes a museum of numbers. An exhibitor profile view may matter only when it comes from a target buyer segment, repeats more than once, or leads to a save, message, meeting request, or scan. A meeting request matters more when it is accepted and attended. A sponsored placement matters more when it creates engagement from the audience the sponsor paid to reach.
The diagnostic is straightforward. If a metric cannot pass at least one of these tests, it should not lead the report:
- Does it show buyer intent? The attendee took an action that suggests interest
- Does it show exhibitor value? The action can support follow-up, lead quality, or sales activity
- Does it support a decision? The organizer can use it for renewal, pricing, placement, or program design
Some organizers will still want a full activity appendix. That is a fair position, especially when portfolio teams need historical baselines. Even so, executive reports and renewal reports need sharper judgment, because too much data can make value harder to see.
How unified data proves value
Unified event data proves exhibitor value by connecting registration, engagement, meeting activity, lead capture, and sponsorship performance into one commercial view. The goal is to reduce data reconciliation and give organizers enough confidence to act before renewals are at risk, rather than to collect more data for its own sake.
Connect registration, meetings, engagement, and leads
Registration is often treated like an administrative task, but it is the first data source in exhibitor ROI reporting. Job title, company type, buying role, interests, region, attendee category, and ticket type can all shape how organizers match buyers to exhibitors and explain audience quality. If that data never connects to meeting activity or lead capture, its commercial value is limited.
Meeting activity adds the next layer. Hosted buyer programs, curated meetings, and attendee-to-exhibitor requests show whether the audience moved from interest to action. Lead capture then completes part of the picture by showing which conversations became usable contacts for exhibitor follow-up. Add sponsorship performance into the same record, and organizers can finally show how visibility, engagement, and lead generation worked together across the exhibitor journey.
Protect confidence by designing for adoption
Adoption is not a vanity metric when it affects signal quality. If attendees do not use the event app, save exhibitors, request meetings, scan booth QR codes, or engage with sponsored content, the reporting system loses evidence. Attendee engagement is directly tied to exhibitor value, not a separate audience experience project.
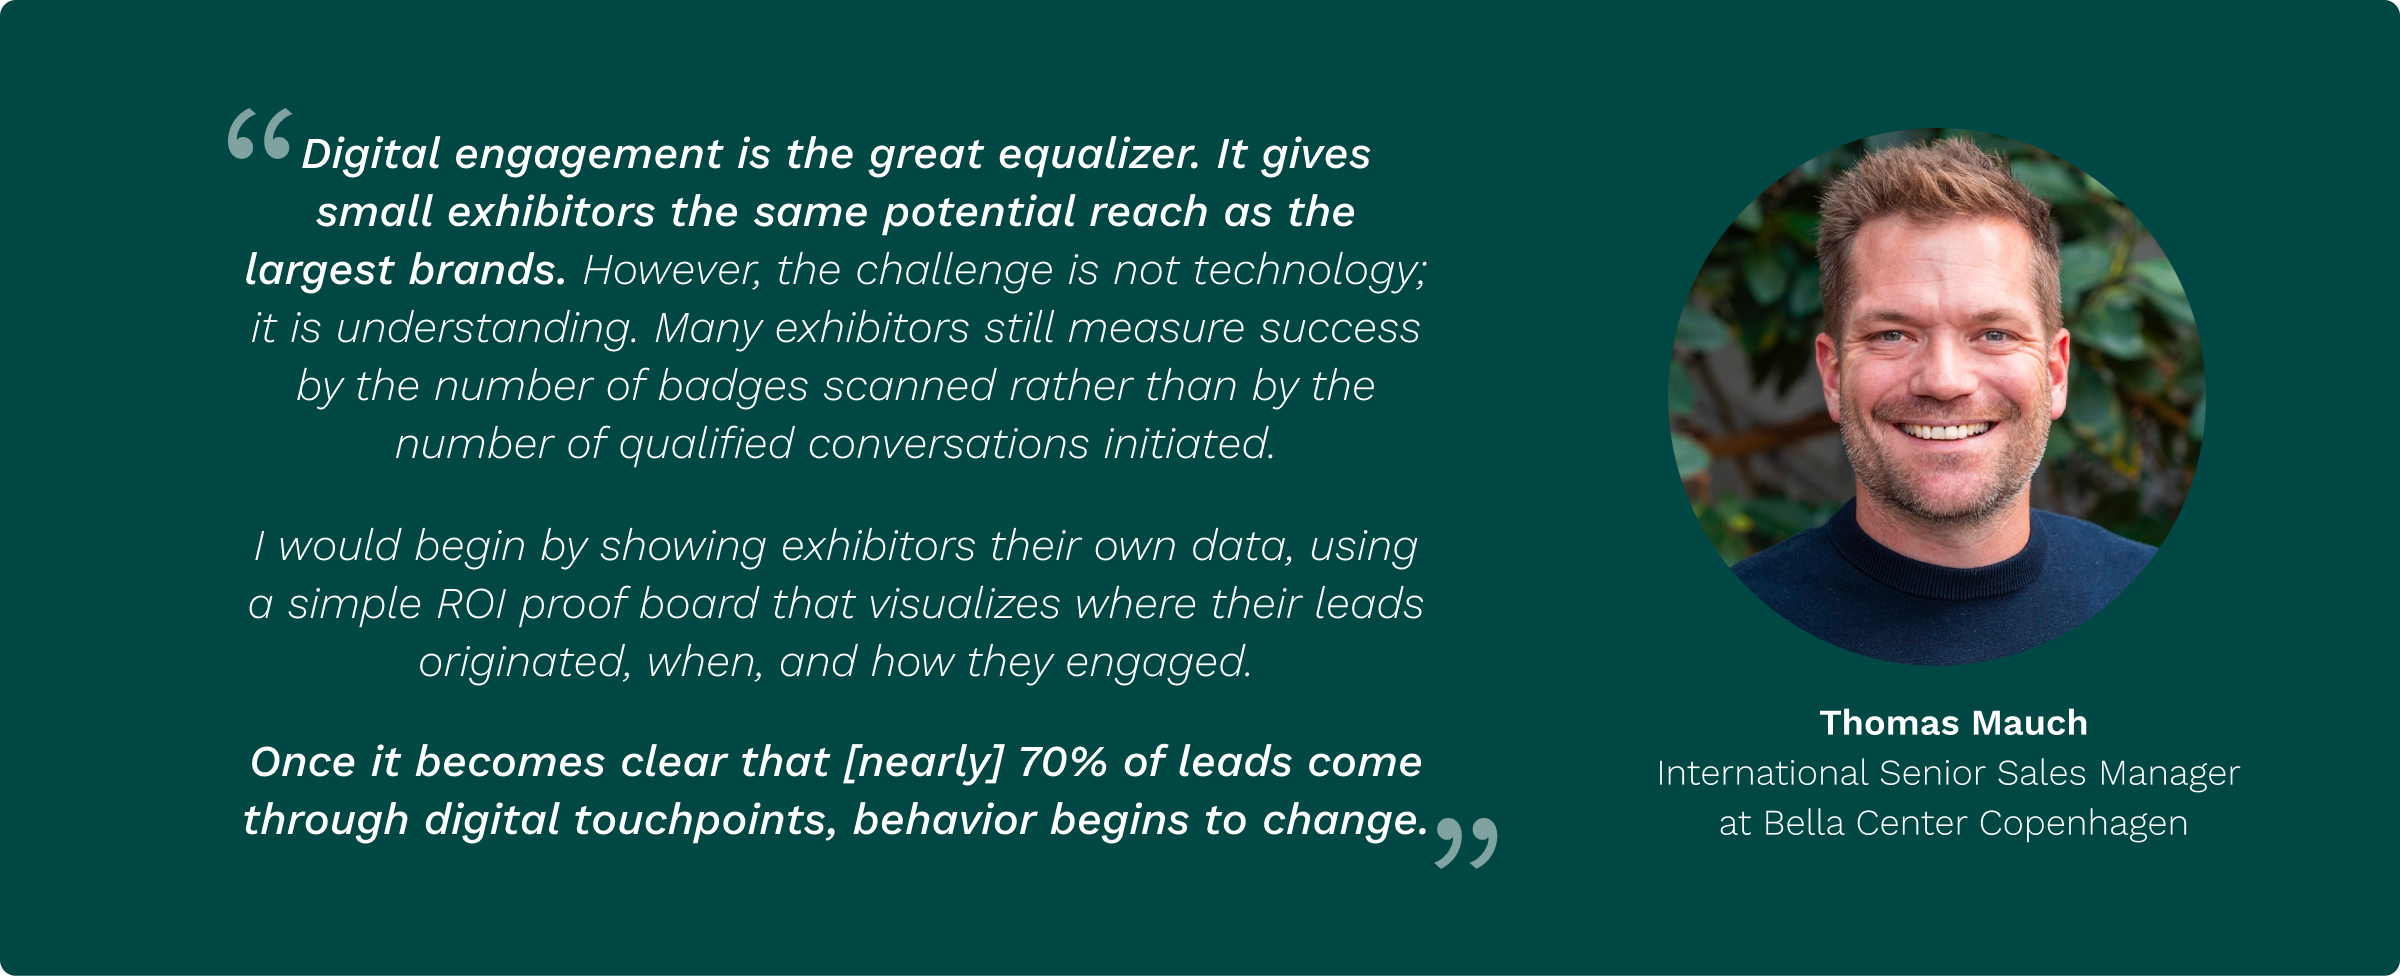
The operational rule is simple. Any metric that depends on attendee behavior needs an adoption plan. Open the platform early enough for pre-event discovery, give attendees a reason to complete their profile, and make meeting scheduling easy to understand. Train exhibitors before they arrive onsite, not during the morning rush. Good reporting depends on the event team making the right actions obvious.
Use customer proof to stress-test the model
Real event programs show why unified reporting matters. HLTH needed structured networking and measurable lead generation across 12,000+ attendees and 900+ sponsors and exhibitors. The event saw a 91% attendee active user rate, 95% of active users made at least one connection, and exhibitors recorded 29,873 badge scans, up 18% year over year. The takeaway goes beyond strong numbers: adoption, networking, and exhibitor outcomes were all connected in one commercial story.
The HLTH team described it this way: "We're bringing the right people in the right ecosystem together and giving them the opportunity to engage digitally." They added, "It gives them the opportunity to take advantage of everything the event has to offer." That is the language of a reporting model that goes beyond attendance. It connects audience participation to exhibitor opportunity.
Vincenzaoro shows a similar pattern for a global audience, with 60% international attendees from 141 countries, 25,000 app downloads, and 165,000 exhibitor profile views. Their team was direct about the outcome: "Using Swapcard for our exhibitors is really important to maximize their return on investment." For organizers building event ROI models, that kind of proof is useful because it shows how engagement data supports both attendee experience and exhibitor value.
Turn reports into renewals and revenue
Exhibitor ROI reporting creates commercial value when organizers use it before renewal, upsell, and sponsorship pricing decisions. A report that sits in a folder after the event is only documentation. A report that shapes exhibitor conversations, package design, and sponsor investment becomes part of the revenue strategy.
Bring proof into renewal talks before the ask
Start renewal conversations with evidence, not booth selection. Walk the exhibitor through audience fit, meeting activity, qualified leads, digital engagement, and sponsorship exposure, then connect that proof to next year's package. That changes the conversation from "Will you renew?" to a structured review of what worked, what underperformed, and what to improve next time.
The timing matters. If the first ROI conversation happens after the invoice goes out, the organizer enters the conversation at a disadvantage. Reports should be ready early enough for commercial teams to identify at-risk exhibitors, high-performing sponsors, and expansion candidates. For portfolio organizers, that also helps compare event editions without relying on memory or one-off anecdotes.
Use reporting to price sponsorships with confidence
Sponsorship pricing gets stronger when organizers can prove performance. A sponsored placement that generated profile views, content saves, booth visits, meeting requests, and qualified leads is easier to renew or repackage than a logo placement with no behavioral data attached. Sponsorship performance belongs beside lead capture and meeting activity in the same report, not in a separate sponsor recap.
Manual selling makes this harder because each package becomes a custom promise that someone has to track by hand. A more scalable approach uses reporting to identify which inventory creates real engagement, then turns those surfaces into repeatable packages. If a sponsor's goal is lead generation, the report should show lead quality and follow-up readiness. If the goal is visibility among a niche buyer group, the report should show audience fit and engagement from that group. That is how exhibitor sponsor ROI becomes a pricing conversation and a renewal asset.
Where Swapcard fits in the reporting workflow
The framework above describes what good exhibitor ROI reporting requires. Swapcard connects the data sources that typically sit apart: registration, event app behavior, Smart Meetings and Hosted Buyer activity, Exhibitor Marketplace engagement, Lead Capture and Qualification, and the Exhibitor Lead Center.
In practical terms, organizers can use Registration to capture audience data from the start, AI Matchmaking and Recommendations to turn attendee behavior into relevant connections, and Smart Meetings and Hosted Buyer to structure high-value meetings. Exhibitors capture leads through badge scans, booth QR codes, business card scans, and lead qualification forms, with captured contacts landing in the Exhibitor Lead Center. Marketplace and Items and Booth Sales add another layer by showing which exhibitor profiles, products, offers, and content attracted attendee interest.
Next steps
Exhibitor ROI reporting is the discipline of proving exhibitor value with connected data. Organizers need registration, meeting activity, attendee engagement, lead capture, sponsorship performance, and renewal signals working together so the story is clear before exhibitors question the spend.
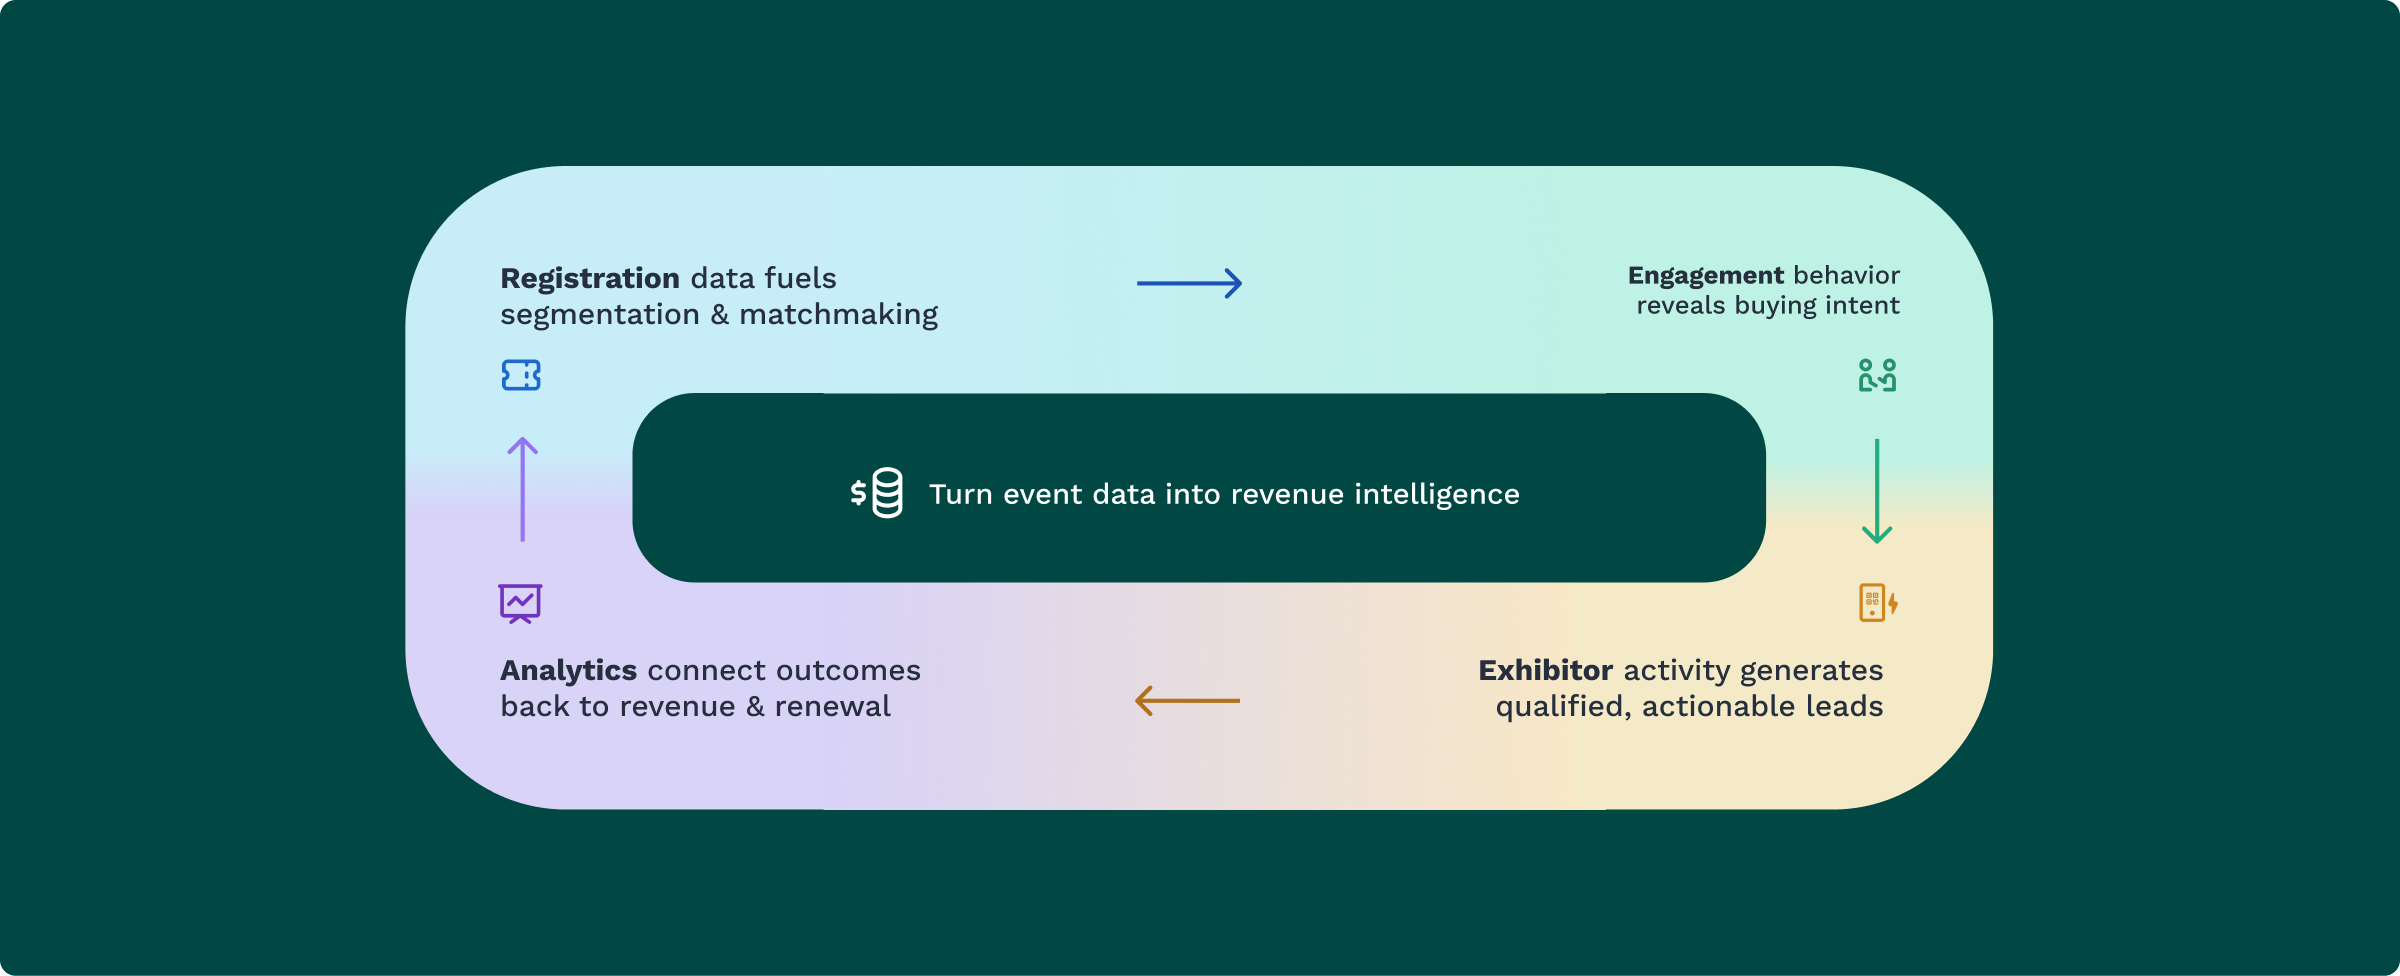
Start with the signals that show buyer intent and commercial value, then build reporting around decisions: which exhibitors should renew, which sponsors should expand, which packages need rethinking, and where the next event can create stronger outcomes. That is how event teams move from reporting what happened to proving why the event is worth more next time.
FAQs (4)
How do I ensure exhibitors get the most from their profiles? To maximize exhibitor profile engagement, start by encouraging them to utilize the Item Gallery feature in Swapcard. This allows exhibitors to showcase specific products and services, making their profiles more dynamic and engaging. Additionally, remind them to actively update their profiles with relevant content and offers to attract attendee interest. Regularly check analytics on profile views and engagement metrics to help exhibitors understand what works and what needs improvement.
What if my exhibitors are not seeing enough leads? If exhibitors are struggling with lead generation, first assess their engagement strategies. Encourage them to use the lead capture tools available in Swapcard, like badge scanning and business card OCR, to streamline the process. Also, suggest they participate in Smart Meetings, which pairs them with relevant buyers based on intent and profile, ensuring they have quality conversations. Finally, analyze the data from the Exhibitor Lead Center to identify which strategies are yielding the best results.
When should I start preparing for renewal conversations with exhibitors? Start preparing for renewal conversations as soon as the event concludes. Use the data collected through Swapcard's registration and engagement features to provide exhibitors with insights on their performance. Aim to have a report ready within a few days of the event's end, detailing key metrics like qualified leads and engagement levels. This proactive approach helps exhibitors see the value of their investment and can significantly improve renewal rates.
Can I track engagement metrics in real-time during the event? Yes, you can track engagement metrics in real-time using Swapcard's analytics features. During the event, monitor attendee interactions such as session attendance, booth visits, and meeting requests. This data allows you to make informed decisions on-the-fly, ensuring that exhibitors are getting the visibility they need. After the event, you can use this data to compile comprehensive reports that highlight exhibitor performance and help guide future strategy.

Bhavya Sharma
Senior Content Marketing Manager
Shapes content strategy across the funnel at Swapcard, from awareness messaging to thought leadership, driving B2B SaaS growth through research-backed storytelling.


Join 12,000 subscribers and unlock industry secrets.
By submitting this form, you agree to receive periodic emails on insightful content related to events and our product, and in accordance with our Privacy Policy. You can, of course, change your preferences or unsubscribe at any time.

.svg)


.svg)
.svg)
.svg)
.svg)


