Maximize engagement & revenue at your next event
We analyzed 600+ Trade Show Organization and Media Company events with 1.9 million users, and 500+ Association and Nonprofit events with 500K+ users across different event sizes and regions.
This comprehensive study identified untapped potential in the digital layer and demonstrated how event engagement can become a strategic revenue stream.
Access Report

Why read this report?
For trade show organizers with tighter budgets and higher digital expectations
This report shows how organizers must go beyond booth sales and badge scans to prove ROI.
Drive lead generation before, during, and after the event
Equip exhibitors with digital tools for performance
Turn attendee interactions into a measurable outcomes
For associations trying to earn attention in a crowded landscape
Get insights on how associations deliver strong brands and engaging experiences that resonate to create real value.
Activate members early and sustain engagement
Balance sponsor and attendee value
Build a digital strategy that drives revenue
↑10% pts.
increase in activation rate could result in a 6–6.5% points increase in event engagement rate
Over 60%
networking—connections and meetings requests—are sent before the event even starts
44%
of leads are created via online booth visits, highlighting the importance of a marketplace listing
15-25%
of event leads come from attendees who engage with session content at events
USer Activation & ENGAGEMENT
Early activation fuels higher engagement
The data showed a clear positive correlation between event activation and engagement—higher activation levels consistently drove stronger engagement.
For Trade Show Organizations and Media Companies, opening the event platform three weeks before the event resulted in an activation peak seven days prior, creating four extra days for user onboarding.
For Associations and Nonprofits, following the same approach led to an activation peak eight days before the event, providing five additional days to onboard users.


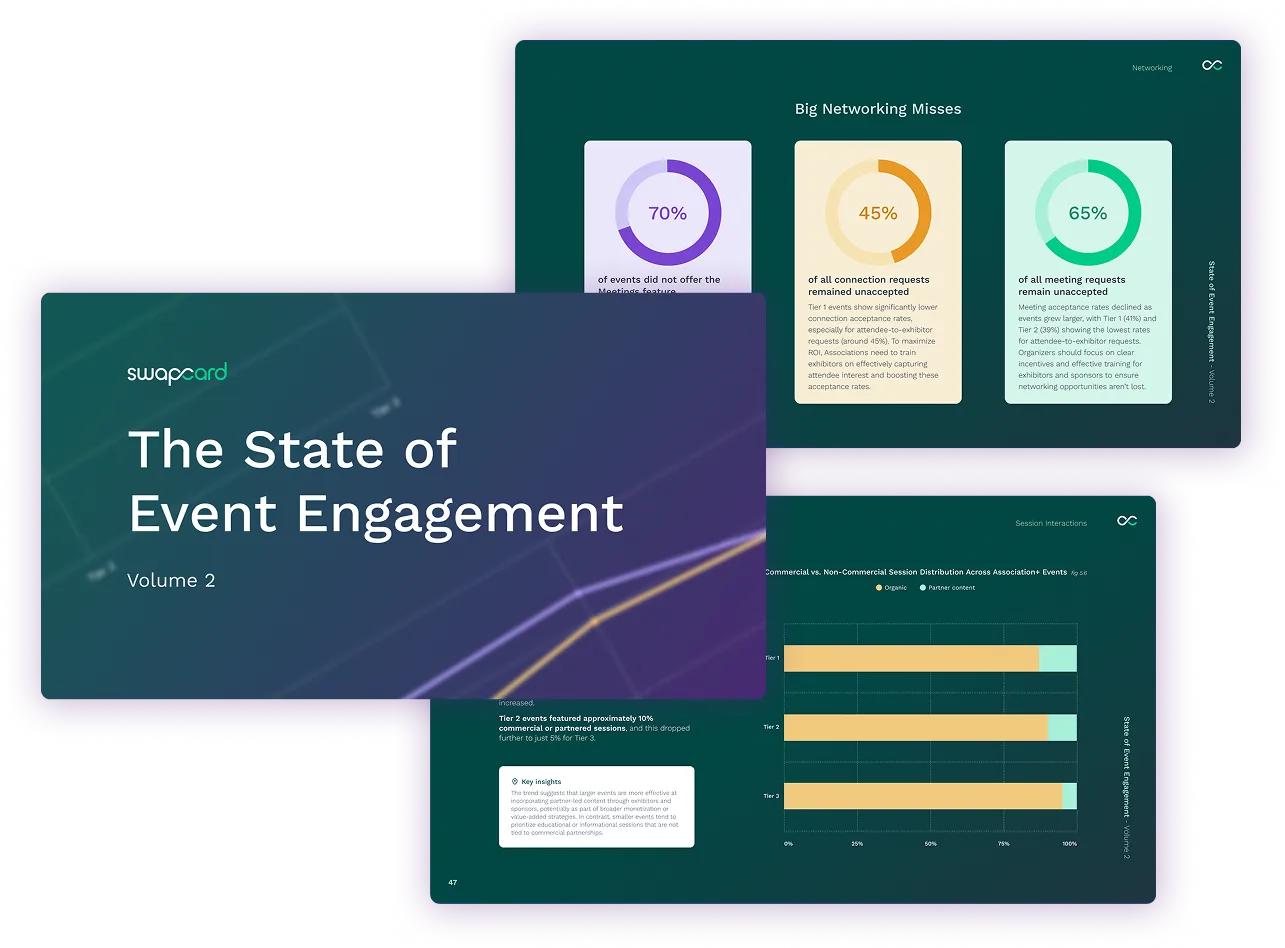
EVENT networking
Enhance networking with AI
On average, half of all networking requests per event, are unaccepted.
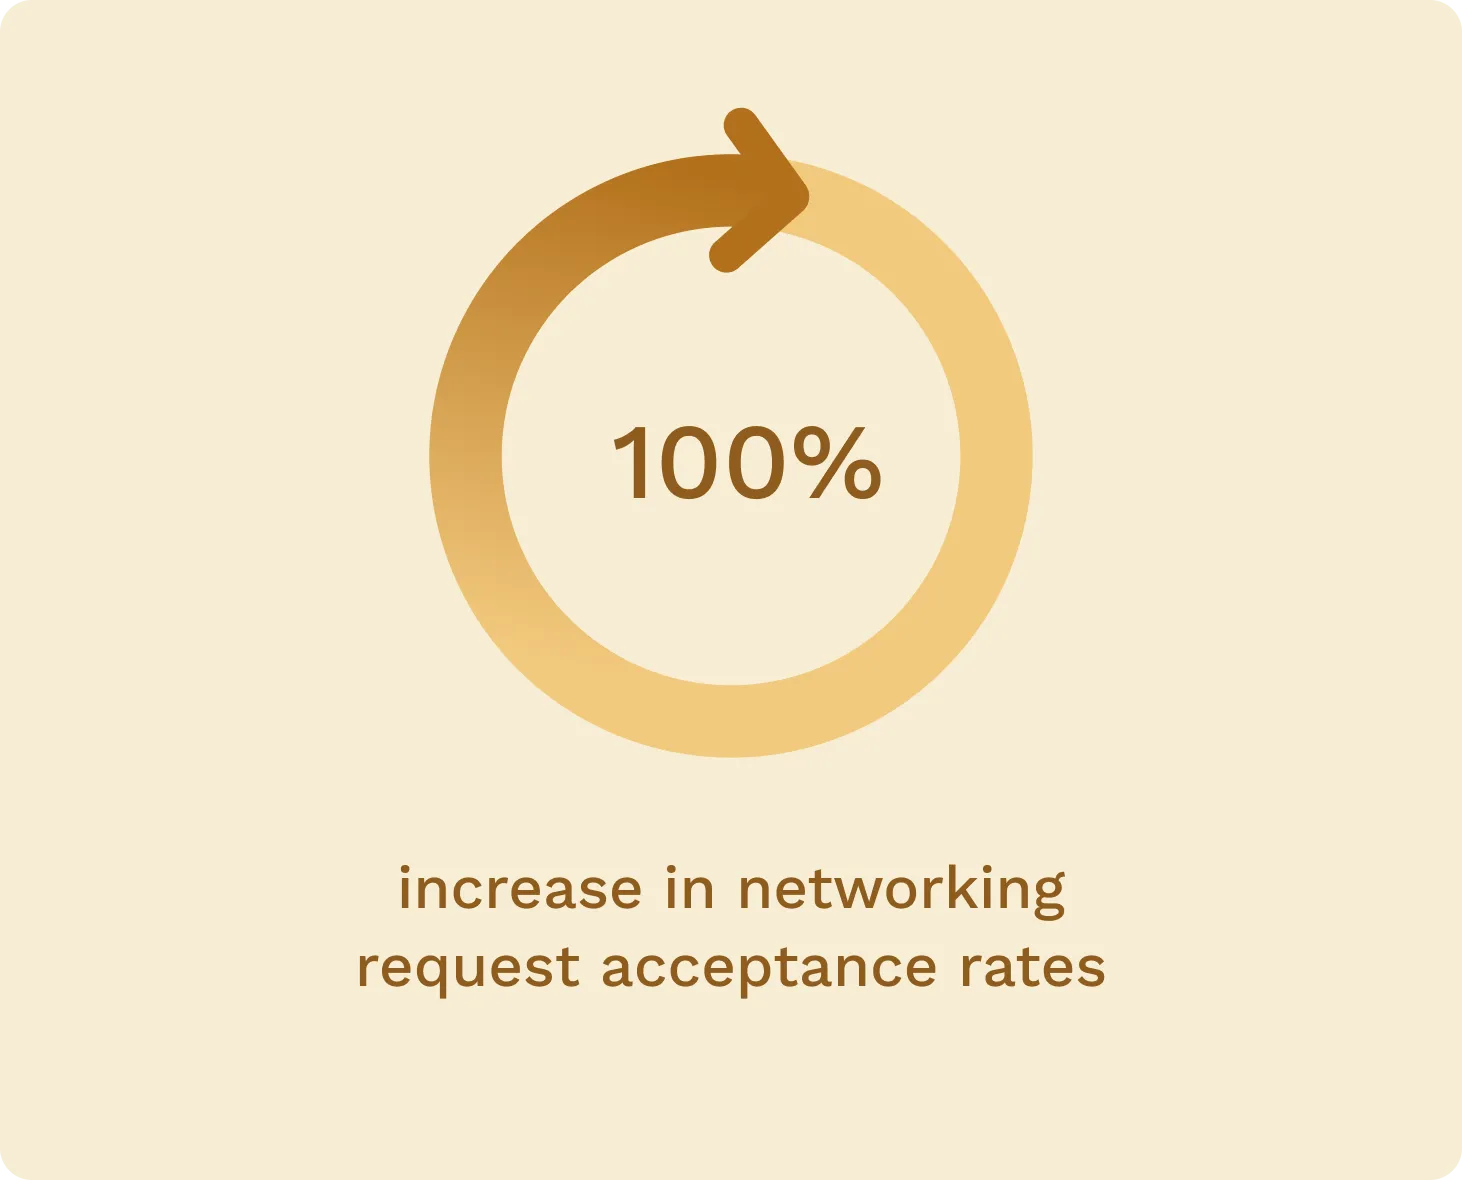
AI-powered recommendations significantly boost networking acceptance rates—100% increase at Trade Show+ events, and 45% increase at Association+ events.
Yet, 25–30% of events are not using AI to optimize attendee networking.

Lead Generation & Exhibitor ROI
Digital engagement drives sponsor & exhibitor value
Data showed that 40% of lead generation happened before the event, and online booth visits were the top lead generating action, driving 44% of leads, across all events tiers.
Organizers who rely solely on traditional booth sales or undervalue digital engagement risk missing sponsor expectations—and leaving measurable revenue on the table.

Session Interactions
Match session format to attendee behavior to increase engagement
At Trade Show Organization+ and Association+ events, sessions play a central role in delivering education and professional value—but engagement varies by tier.
Audiences at Tier 2 and Tier 3 events are most engaged with live-streamed content, showing higher view completion rates. In contrast, Tier 1 Association+ events show steady engagement around 50%, regardless of delivery format.
To increase session engagement, align delivery methods with audience preferences: prioritize live streams for smaller events, invest in high-quality content and discovery tools for larger ones.


What the experts are saying
"Exhibitor ROI is not guaranteed just because you fill a hall."
Associations need to double down on intentional matchmaking, data-driven personalization, and value-before-venue thinking.
Mid-sized events win because they strike the perfect balance: big enough for buzz, small enough for intimacy. Prioritize engagement over attendance: 500 attendees who lean in are more valuable than 5,000 who simply walk through.

"AI has become ubiquitous in our lives."
Attendees have such limited time to navigate a conference, so we must use every tool available to make this process seamless.
I see personalized attendee journeys—ones that include education sessions, meet up opportunities, special events, and exhibitor recommendations—as a huge value add for any event.
.webp)
"Publishing content before the event can help drive attendee engagement and support planning."
Giving exhibitors an opportunity to participate with pre-show content can encourage earlier digital presence and booth listings, improving potential connections.
.webp)
Former CIO at NAMM
executive letter excerpt
Shaping the future of events
Across Trade Show Organizations, Media Companies, Associations, and Nonprofits, event leaders are navigating an increasingly complex landscape—shaped by shifting global dynamics, tighter budgets, and heightened pressure to deliver ROI.
While attendance is rebounding, organizers face the challenge of proving value for attendees, sponsors, and exhibitors, all while sustaining growth and loyalty.
We analyzed data from more than 1,100 events and over 6 million users worldwide. The findings reveal untapped digital potential across four key performance areas: User Activation & Engagement, Networking, Exhibitor & Sponsor ROI, and Session Interactions.
Together, these insights establish a new performance standard—outcomes over activity—empowering leaders to modernize event delivery, deepen stakeholder value, and build a digital-first revenue strategy that drives measurable growth.

Baptiste Boulard
CEO & CO-Founder | Swapcard

Frequently Asked Questions (FAQ)
Understanding our event engagement data & methodology

Trade Show Organizations are groups or entities that coordinate and manage events where businesses showcase their products and services. Their primary goal is to create business opportunities through exhibitions, networking, and education. While their focus is on trade shows, they also host conferences, webinars, and workshops that advance their industry’s growth.
Media Companies are organizations that create, produce, and distribute content such as news, entertainment, or information across different platforms. Many generate revenue through events, advertising, or subscriptions. When included in this report, their event data is analyzed together with Trade Show Organizations to provide a clearer industry benchmark.
Associations are groups of individuals or organizations united by a common interest, profession, or purpose. Their mission is to serve members through networking, advocacy, education, and shared resources. While many operate as nonprofits, their primary focus is on advancing the professional or industry needs of their members rather than broader public charity.
Nonprofits are organizations created for the public good rather than for profit. Any revenue beyond expenses is reinvested to further their mission, which could include education, advocacy, research, or community support. Many nonprofits are tax-exempt and rely on donations, grants, and membership fees to operate.
Trade Show Organization+ Events refer to events organized by Trade Show Organizations and Media Companies.
Association+ Events refer to events organized by Associations and Nonprofits.
Event sizes are divided into tiers based on registered users:
Trade Show & Media Events
- Tier 1: 10,000+ users
- Tier 2: 1,001–10,000 users
- Tier 3: 1–1,000 users
Association & Nonprofit Events
- Tier 1: 2,500+ users
- Tier 2: 501–2,500 users
- Tier 3: 1–500 users
This tiered structure allows for meaningful comparisons across different types of organizations.
Events are categorized into three regions for analysis:
- North America (NA)
- Europe (EU)
- Rest of the World (RoW)
This breakdown highlights regional differences in engagement and event performance.
Trade Show Organizations & Media Companies - Data from 600+ hybrid and in-person events on Swapcard in 2024, covering nearly 5.5 million registered users and 1.9 million active participants.
Associations & Nonprofits - Data from 500+ hybrid and in-person events on Swapcard in 2024, covering over 600,000 registered users and 300,000 active participants. Additionally, insights from 100 surveyed event professionals enrich the findings.
The findings represent actions taken on the Swapcard platform, such as registrations and online engagement. Not all in-person interactions are captured, and some data may be incomplete if event organizers used multiple unconnected platforms or did not activate certain features. These limitations are noted in the report where relevant.
This report analyzes a large and diverse dataset of over 1,100 events across Trade Show Organizations, Media Companies, Associations, and Nonprofits during the 2024 calendar year. The dataset includes millions of participants, ensuring statistically meaningful results. Percentages have been rounded for simplicity, and survey responses from professionals add an extra layer of industry insight.
Maximize engagement & revenue at your next event
Discover benchmarks and insights focused on user activation, networking, exhibitor ROI and session engagement.