


Exhibition floor plan design: Treat booth placement as a revenue decision
58% of 500+ B2B exhibitors surveyed in Swapcard's Exhibitor Friction Report named lead generation and engagement as their #1 challenge. That makes the conference floor plan a revenue decision long before it becomes a venue diagram. Booth placement shapes who reaches each sponsor, which is why layout decisions belong in the revenue conversation before the onsite walk-through.
Most floor plans are built to reduce complaints: keep aisles open, protect fire lanes, and make the venue work. Operational friction matters. Yet sponsors do not pay for balanced circulation. They pay for concentrated access to the right attendees and evidence they can take back to leadership to prove ROI.
The missed opportunity is hiding in plain sight. A sponsor sitting near the entrance may get heavy footfall and weak intent, while a sponsor next to a high-value content track may get fewer visits but stronger meetings and a cleaner renewal story. That is the shift organizers need to make: evaluate the floor plan as a revenue model.
Key Takeaways:
- Floor plan design directly shapes sponsor traffic quality, not just attendee movement
- Booth placement is one of the few controllable organizer levers that affect sponsor traffic and lead generation
- High-volume entrances and high-intent dwell zones should be priced differently
- Zone analytics should connect footfall, dwell time, badge scans, meetings, and lead quality
- Traffic and engagement data by zone helps sponsors prove event ROI internally
- Demonstrated placement value gives organizers a stronger case for premium pricing and sponsor renewal
Why traffic beats convenience in floor plan decisions
A conference floor plan should be judged by the sponsor value it creates, not only by how smoothly people move through the venue. When placement choices shape booth traffic, dwell time, and meeting opportunities, organizers control a direct lever for exhibitor ROI. The wrong layout can look efficient onsite while weakening the renewal conversation later.
If your team is already rethinking how placement connects to sponsor outcomes, that is exactly the core tenet of the Swapcard platform and worth keeping in mind as the framework below takes shape.
The real mistake is optimizing for movement alone
It's three days before doors open. You're the sponsorship director, with the venue CAD file on one screen and the exhibitor priority spreadsheet on another. Three anchor sponsors have emailed in the past hour asking why their booths moved 30 feet from last year. Sales needs the prospectus by morning. Operations needs the fire lane sign-off tonight. And the floor plan gets finalized based on who pushed hardest and not who delivered the most measurable value last edition.
It is easy to see why teams default to what worked last year. It feels safer. The problem is that "worked" often means the show opened on time, not that every high-value sponsor reached the right audience. A smooth conference floor plan can still underperform commercially if it spreads attendees evenly across zones with very different intents. High-volume paths near registration and main entrances do one job: they create exposure. High-intent dwell zones near technical sessions or hosted buyer lounges do another job entirely: they create the conditions for qualified conversations.
Think of the floor plan like a retail shelf, not a parking lot. A parking lot is successful when everyone can enter and leave without frustration. A retail shelf is successful when the right product sits in the right position for the right buyer at the right moment. Sponsors are buying access to attention they can convert. For organizers reviewing their commercial model, that distinction changes the whole pricing conversation, and it is why the first step is to connect layout decisions to exhibitor sponsor ROI instead of treating placement as a courtesy.
Exhibitors are telling organizers where the pressure sits
The biggest complaint from exhibitors is not the venue or the booth package. It is not getting enough of the right people to their booth. In Swapcard's Exhibitor Friction Report, 58% of 500+ B2B exhibitors surveyed said lead generation and engagement is their #1 challenge: the most common problem organizers are being asked to solve. Booth traffic is not a soft experience metric. It is the front door to exhibitor revenue.
A fair counterpoint: organizers cannot force attendees to visit every sponsor. A sponsor with weak messaging or poor booth staffing will struggle even in a strong location. That is true, and event teams should not be responsible for every exhibitor's outcome. The sharper point is that placement sets the ceiling for opportunity. A sponsor cannot convert the right people if the right people never walk past.
After day one, the board wants revenue growth, the sales team wants ammunition for renewals, and the sponsors who fought for those booth placements are now asking a harder question: where's the traffic? Without zone data, the only answers available are anecdotal: "it picked up after lunch," "the aisle seemed busy." That doesn't hold up anymore. Sponsors are scrutinizing every line of event spend, and organizers need proof that the floor plan actually produced commercial value.
How to get the right attendees in front of the right sponsors
Organizers can map sellable sponsor placements by separating high-volume paths from high-intent dwell zones, then matching each zone to the sponsor outcome it can realistically produce. Entrances, food areas, and main aisles create visibility. Session-adjacent areas and meeting zones often create better-qualified visits. Better design starts with behavior, not habit.
Start with where attendees already show intent
Before approving premium booth placement, organizers should check which attendee behaviors already signal buyer intent. Session bookmarks, exhibitor profile views, meeting requests, and dwell time near category-specific areas all tell a richer story than a venue map alone. In my view, this is where sponsorship models still lag: they price proximity to entrances because it is visible, not because it is always valuable.
High-volume paths are useful, of course. Main entrances, badge pickup routes, and coffee stations can create broad awareness for brand-led sponsors. For sponsors selling complex products or services, though, the better placement may sit near a related content stage or a lounge where attendees naturally slow down. If a cybersecurity sponsor wants chief information security officers, the best zone may not be the busiest aisle. It may be the 40-minute dwell area outside the enterprise risk track.
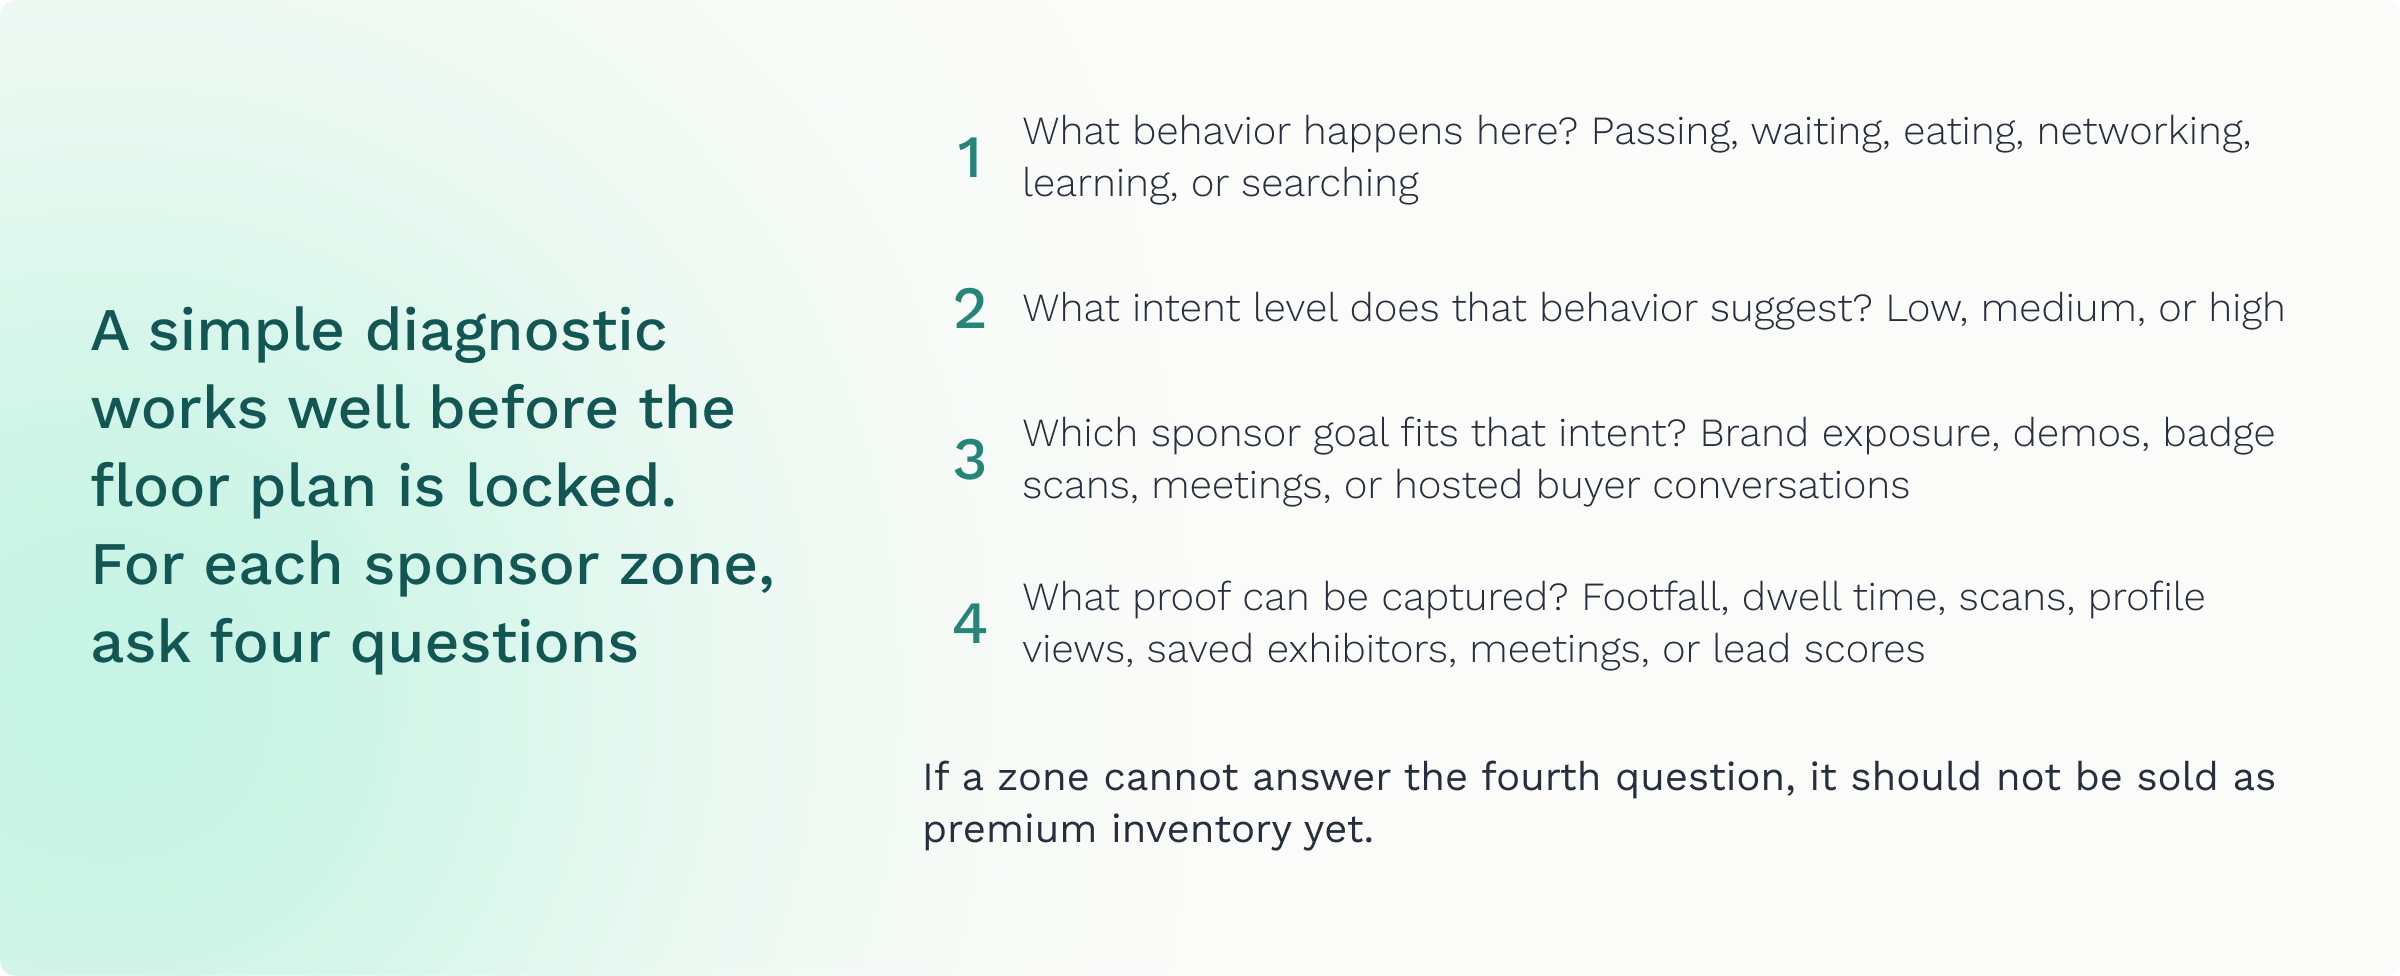
Compare entrances with content-adjacent zones
Premium entrances and content-adjacent zones solve different sponsor problems, and organizers should stop pricing them as if they are interchangeable. Entrance placements create fast exposure because nearly everyone passes through at least once. That makes them useful for major brand takeovers, product launches, or sponsors that want maximum recognition before attendees make any agenda choices.
Content-adjacent placements work differently. They may produce fewer total impressions, but the visits can be far more valuable because the audience has already self-selected by topic. A medical device exhibitor near a clinical innovation session, or a fintech sponsor near a payments track, can read the traffic differently from a sponsor placed near general registration. That traffic carries context.
The distinction matters because qualified visits and casual booth traffic produce very different pipeline. A badge scan after a session, a meeting request from a bookmarked exhibitor profile, or a return visit after a product theater carries more commercial value than a quick walk-by at an entrance. Organizers who sell all high-traffic spots as "premium" risk training sponsors to value the wrong thing. The stronger model defines premium sponsorship inventory by outcome type, not carpet position.
Use historical behavior data before stakeholder preference
Historical attendee behavior data should be the first input for layout planning, with venue habits and stakeholder preferences treated as constraints rather than the starting point. Trade show and conference organizers often begin with last year's map, then layer sponsor requests and operations needs on top. That process is understandable. It is also where missed opportunities start.
A better planning sequence begins with three sets of data: prior footfall analytics, digital engagement signals, and commercial outcomes by zone. Footfall shows where people moved. Dwell time shows where they paused. Scans, meetings, and exhibitor profile activity show which zones created measurable sponsor value. When those inputs are reviewed together, the layout becomes a commercial planning tool instead of a venue diagram.
Not every event has perfect data. Smaller association conferences, first-year trade shows, or events changing venues may have gaps, and that is valid. In those cases, organizers can still build a first version using proxy signals: registration categories, ticket types, session demand, meeting requests, and exhibitor categories. The goal is not a flawless model. The goal is to stop making layout decisions based only on who bought first or where the keynote stage happened to sit last year.
Protect zones that already create sponsor value
High-performing zones should be protected before they are sold, redesigned, or overloaded with competing sponsor assets. It is tempting to monetize every visible surface on a busy route, especially when revenue targets are tight. Yet too much inventory in one area can dilute attention and make it harder for any single sponsor to prove value.
Organizers should treat strong zones like scarce commercial assets. If a coffee area produces high dwell time and strong scans for two adjacent sponsors, adding six more sponsor kiosks may not increase value. It may simply divide the same attendee attention across eight brands instead of two. A well-designed layout protects intent-rich moments the same way a strong session program protects room capacity.
A practical rule: if a zone already drives high meetings per exhibitor or strong scan-to-meeting conversion, protect it from clutter before adding new inventory. If a zone drives heavy footfall but weak engagement, redesign it with stronger reasons to pause. If a zone drives neither, stop selling it as premium until the behavior changes. Those calls are easier when organizers can show sponsors what the zone actually does.
How to measure and price zone value
Zone value should be measured through the relationship between footfall, dwell time, scans, meetings, and qualified lead outcomes. Flat sponsorship packages hide those differences, while data-backed tiers let organizers price areas based on demonstrated commercial value. The stronger the proof, the less renewal depends on opinion.
Build the zone analytics sponsors actually need
Sponsors need zone analytics that connect traffic to outcomes, not just a heat map that shows a crowd. Footfall matters because it shows exposure. Dwell time matters because it shows attention. Badge scans, meetings, and qualified leads matter because they show commercial action. Without that chain, a sponsor sees activity but still struggles to prove value internally.
The Exhibitor Friction Report also found that 16% of exhibitors cannot reliably prove ROI to leadership. That number points to a renewal risk that organizers can directly reduce. If a sponsor cannot show leadership on what happened in their zone, the renewal conversation becomes subjective. Traffic and engagement data by zone gives sponsors the missing evidence: how many attendees entered the area, how long they stayed, and which interactions became leads or meetings.
A useful zone report should separate three layers of value:
- Exposure: footfall, map views, exhibitor profile views, and sponsor asset views
- Engagement: dwell time, booth bookmarks, chat activity, and session-adjacent activity
- Commercial action: badge scans, booth QR code scans, meetings booked, lead scores, and follow-up-ready contacts
A sponsor renewal deck does not need every available metric. It needs a few metrics that explain why the placement deserved its price.
Price placements on demonstrated value, not package tradition
Flat sponsorship packages are easy to sell, but they hide the difference between visibility and intent. Gold, silver, and bronze tiers can work for simple sponsorship programs, but they often treat every sponsor surface as a checklist item: logo here, booth there, app banner somewhere. The package feels complete, yet it says very little about the value each placement actually delivered.
Data-backed placement tiers price zones based on the type and quality of attendee behavior those zones create. Entrance zones may carry a visibility premium because they reach nearly every attendee. Content-adjacent zones may carry an intent premium because they sit near relevant sessions and buyer clusters. Hosted buyer or meeting-adjacent zones may carry a conversion premium because they connect sponsor presence to scheduled conversations.
What works best is a pricing model that separates inventory into outcome categories. A brand awareness sponsor buys reach. A category leader buys qualified attention. A demand generation sponsor buys access to meeting-ready attendees. Organizers can package each differently, then use zone analytics to defend the price. Sponsors are far more likely to accept a premium when the organizer can show why the placement earns it.
Turn the floor plan into a sponsor sales asset
A conference floor plan should support sponsor sales before the show opens, not only help attendees navigate once onsite. When organizers can show historical traffic by zone, expected dwell points, and planned engagement moments, the sales conversation becomes much more concrete. Instead of selling "booth 418 near the lounge," the team can sell a zone with a clear behavior profile and proof from the previous edition.
That shift also improves expectation setting. Sponsors with broad brand goals can select high-volume areas. Sponsors with lead quality goals can select zones near relevant content or meetings. Sponsors that need executive conversations can invest in hosted buyer or VIP-adjacent placements. Everyone enters with a clearer idea of what the placement is designed to produce.
For organizers building that commercial layer into the sponsor offer, the next useful move is to connect placement strategy with digital inventory, lead capture, and reporting rather than selling the floor plan alone. See how Swapcard works when sponsor packages need to connect onsite placement, attendee behavior, and measurable lead outcomes in one workflow.
Use internal ROI proof to reduce sponsor negotiation
Document placement performance before the sponsor asks for it; that single habit changes the renewal conversation more than any pricing adjustment. Without evidence, renewal calls become a negotiation over feelings: the booth felt quieter, the sponsor expected more meetings, the competitor looked busier. It is hard to defend pricing when the organizer and sponsor are debating memory.
With zone-level reporting, the conversation moves to evidence. A sponsor can see that their placement generated 3,200 zone visits, strong dwell time during two session breaks, 190 badge scans, 42 scheduled meetings, and a higher lead score than the general expo average. Use the actual numbers from the event, of course. The principle is what matters: placement value becomes visible, and pricing becomes easier to defend.
There is also an important limitation. Data does not remove every renewal objection. A sponsor may still have weak booth staffing, poor follow-up, or internal budget cuts. Yet data does remove the most damaging uncertainty: whether the organizer delivered the access that was sold. That is why organizers who design layouts from behavioral data can prove sponsor ROI, price placements on demonstrated value, and turn renewals from a negotiation into a formality more often than teams relying on layout tradition.
How Swapcard connects floor plan design to ROI proof
Swapcard ties onsite navigation, exhibitor discovery, lead capture, and engagement data into one event workflow, so organizers can show sponsors exactly which zones produced scans, meetings, and qualified leads. That makes placement value easier to prove and easier to sell again.
Interactive floor plans turn navigation into behavior data
Swapcard's interactive floor plan feature gives attendees interactive booth-by-booth maps with exhibitor profile cards, bookmarking, and "find on map" navigation from any exhibitor listing. A map is a signal layer for organizers as much as a service layer for attendees: it shows which exhibitors and zones people actively searched, saved, and visited during the trade show or conference.
The IAAPA Expo story shows why this matters at scale. With an 11-mile show floor, IAAPA needed a better way for attendees to navigate and engage with the agenda across a hybrid event. The team recorded over 7,000 active app users, 23,500 agenda interactions, 8,500 connection requests, and 6,500 discussions. As the team put it, "Because we're a global organization, we actually needed to be able to have a touchpoint with all of these individuals, and having Swapcard was a really great way to do that."
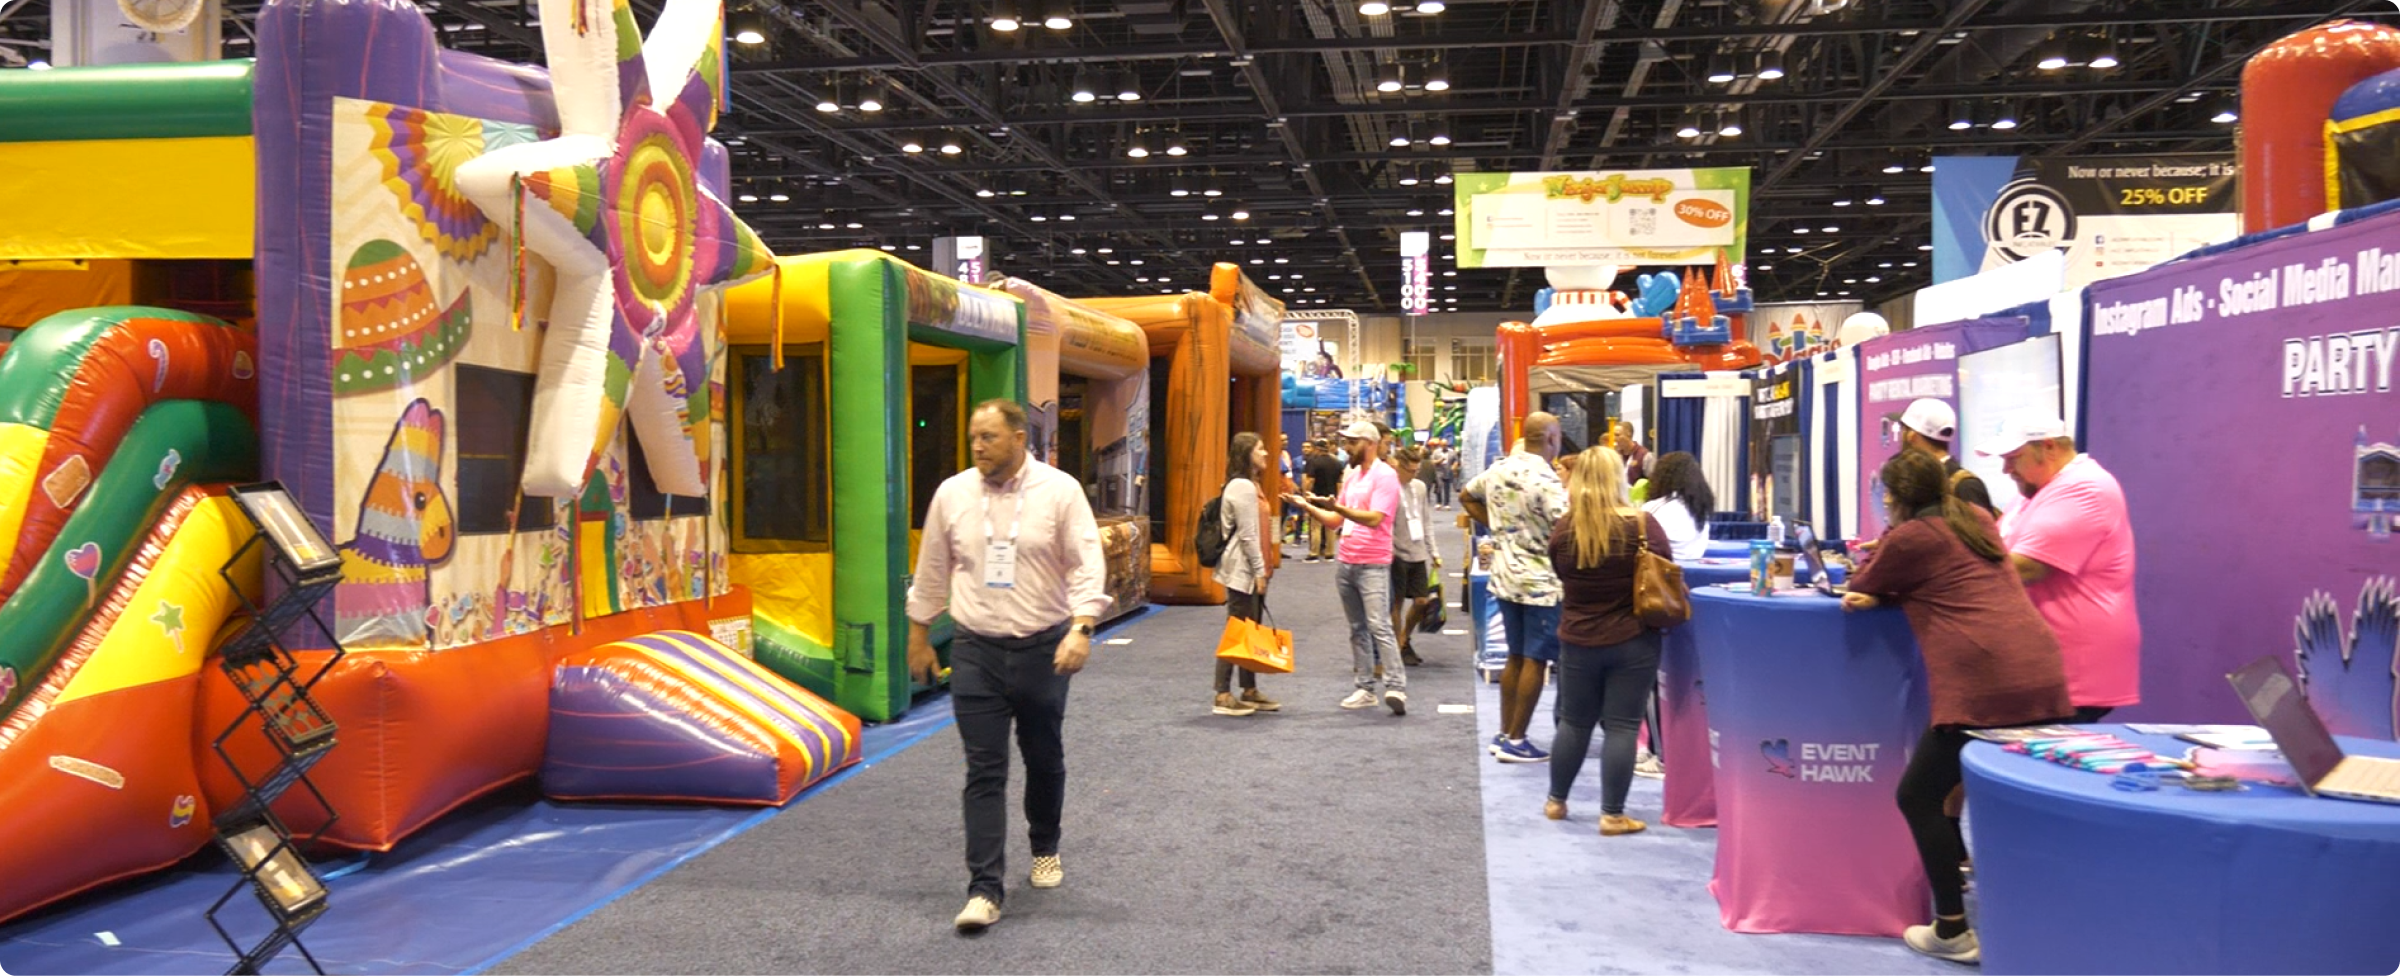
That level of engagement gives commercial teams a direct view of which zones earned attention and which sponsors benefited from placement. Because floor plan discovery connects with Exhibitor Marketplace profiles and Booth QR Code activity, organizers can build sponsor packages around measured behavior rather than static visibility.
Lead capture closes the gap between traffic and follow-up
The commercial consequence of a strong zone shows up in follow-up speed. A sponsor in a well-placed booth should not wait two weeks for a CSV file to learn whether the placement worked. With Swapcard's Exhibitor Lead Center, every captured lead, such as badge scans, business card scans, Booth QR Code activity, chats, and meetings, lands in one inbox with attendee profile details and a qualification score, and exhibitors can export scored leads in real time or sync them into Salesforce or HubSpot. The faster those leads move into follow-up, the easier it becomes to connect onsite conversations with pipeline.
Customer language makes the point clearly: "Using Swapcard for our exhibitors is really important to maximize their return on investment." Another team framed the broader value this way: "We're bringing the right people in the right ecosystem together and giving them the opportunity to engage digitally." For organizers, those quotes reflect the commercial shift from booth placement as a promise to booth placement as measurable sponsor performance. When the next edition needs stronger proof, get started with Swapcard to connect floor plan engagement, lead capture, and sponsor reporting in one workflow.
Build the next floor plan like a revenue model
Start with a three-zone pilot at the next edition: choose one high-volume path, one content-adjacent dwell zone, and one underperforming area that sponsors question every year, then measure each against a commercial hypothesis set before the show opens. Track footfall, dwell time, scans, meetings, and lead quality per zone, and compare performance before renewing or repricing the inventory.
That pilot does not require reinventing the entire expo hall. It requires discipline. Use trade show ROI data and communication design principles to understand whether the layout guided attendees toward the right sponsor moments, then bring the evidence into pricing and renewal conversations.
The old conference floor plan answered one question: where does everything fit? The better version answers the question sponsors are already asking: Did this placement create value we can prove internally? Once organizers can answer that with zone-level evidence, premium sponsorship inventory becomes easier to defend, sponsor renewal becomes less reactive, and the layout stops acting like an operations document. It becomes a revenue instrument.

Bhavya Sharma
Senior Content Marketing Manager
Shapes content strategy across the funnel at Swapcard, from awareness messaging to thought leadership, driving B2B SaaS growth through research-backed storytelling.


.webp)


Join 12,000 subscribers and unlock industry secrets.
By submitting this form, you agree to receive periodic emails on insightful content related to events and our product, and in accordance with our Privacy Policy. You can, of course, change your preferences or unsubscribe at any time.

.svg)


.svg)
.svg)
.svg)
.svg)


